")
Mercury (Latin: Mercurius)
God of financial gain, commerce, eloquence, messages, communication, travelers, boundaries, luck, trickery, merchants, and thieves.
Mercurius ex Machina
Mercurius ex Machina is a long-time ongoing FinTech Project of mine. It is the culmination of my years of experience in teaching graduate-level courses on computational finance and financial intelligence. The project consists of software tools and libraries for quantitative and algorithmic trading that are built from the ground up.
This page briefly demonstrates some sample outputs from the portfolio-builder module. Two markets, namely NASDAQ and BİST (Borsa İstanbul; The Turkish Stock Market) were targeted in the sample study below. For NASDAQ, companies in NASDAQ 100 Index (^NDX) were used, and for BİST, companies in BİST 100 Index (^XU100) were used to build the most efficient portfolios.
The optimization criteria for the examples below include highest Sharpe Ratio, and a balance between low risk and high returns that were computed as a weighted sum in λ (k - Risk) + Return format where λ represents the Risk Aversiveness of the trader, k is the Maximum Risk, Risk is the Risk Score (higher scores indicate higher risks), and Return is the Mean Return (higher values indicate higher returns). Other criteria such as diversiveness across industrues, countries, currencies, geographic regions, etc. could also be incorporated into the optimization process with the provision of such overlay data.
In each example below, The Mercurius System conducted a heuristic search of the Risk/Return space around the target criterion, and around 5 million portfolios of various sizes were generated and analyzed per each optimization session. The relevant portions of the Markowitz Efficient Frontiers (around the optimization criterion) are clearly visible in each of the Risk/Return Plots given below. The Mercurius System runs at blazing speeds and each example below finished the heuristic search in about just 15-20 seconds.
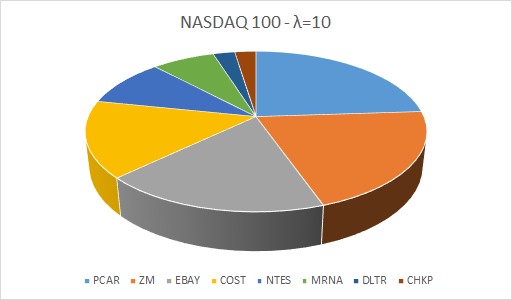
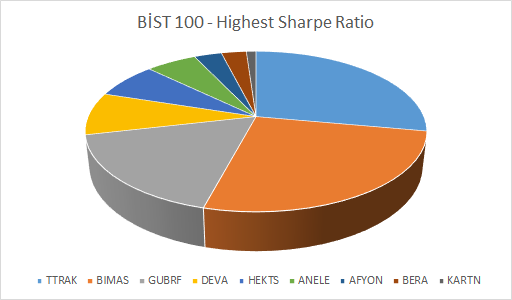
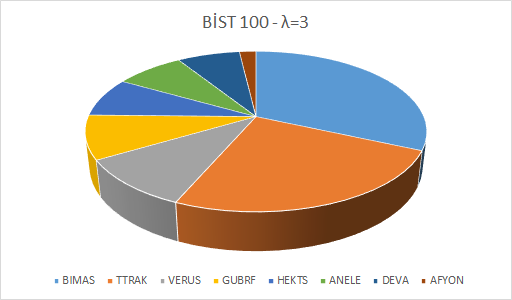
Each example portfolio below is marked with a purple dot in its Risk/Return Space (Risk/Return Plot) (the horizontal axis is the Risk, and the vertical axis is the Return) and the optimal asset weights are shown as a Pie Chart. You may click on each plot/chart to open it up in its full size in a new tab/window.
NASDAQ 100
Highest Sharpe Ratio

NASDAQ 100
λ = 1

NASDAQ 100
λ = 2

NASDAQ 100
λ = 3


NASDAQ 100
λ = 5

NASDAQ 100
λ = 10

BİST 100
Highest Sharpe Ratio

BİST 100
λ = 1

BİST 100
λ = 2


BİST 100
λ = 3
BİST 100
λ = 5

BİST 100
λ = 10